For my Twitter conversations to clarify my use of terms.
OBSERVATIONS. Examples for climate change include temperature, temperature changes, circulation patterns of atmosphere and ocean, energy input from sun, energy losses, back radiation, energy distribution, changes in atmospheric and ocean chemistry and heat content, etc.
DATA. Any series of observations or measurements that are used to create descriptions of trends, relationships, models, cause and effect relationships, or test hypotheses. This example is a series of CO2 atmospheric concentration data from the Mauna Loa observatory shown plotted over time.
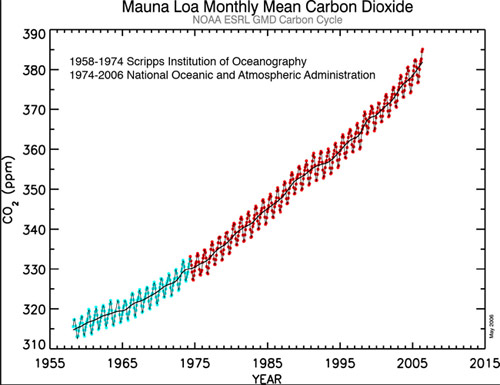
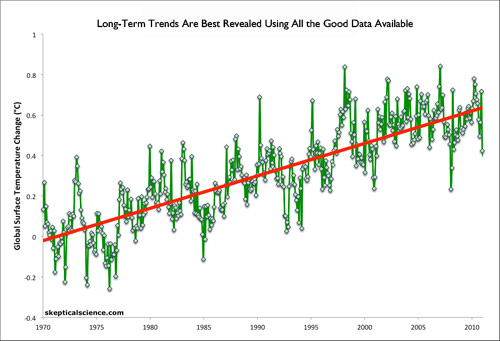
TRENDS. Changes over time, changes with depth or height, etc. demonstrated with trend lines to smooth out the variations. Some sets of observations have very large ranges of variation that can hide or confuse the trend over time. To ease interpretation, various mechanisms are used to calculate the trends by smoothing out the variations. This is not the same as choosing one start point and one end point and ignoring all the information in between.
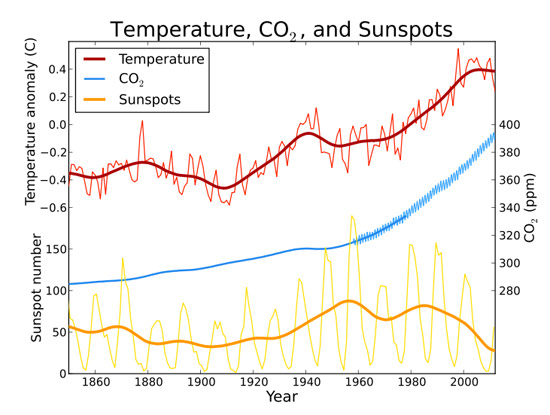
CORRELATIONS. Matching or opposite trends. This example is comparing the upward trend of temperature to the upward trend of CO2 and the downward trend of solar energy.
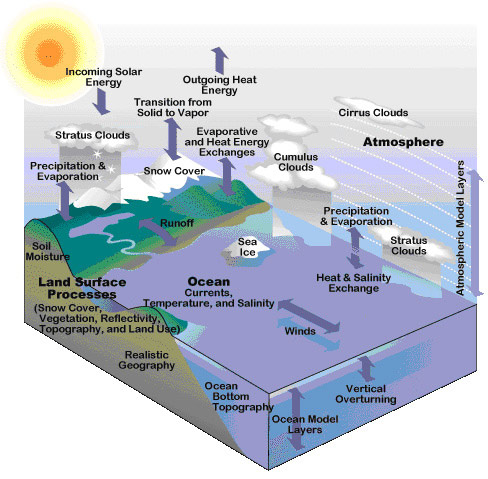
MODELS. This is a visual model of climate energy budgets and circulation patterns.
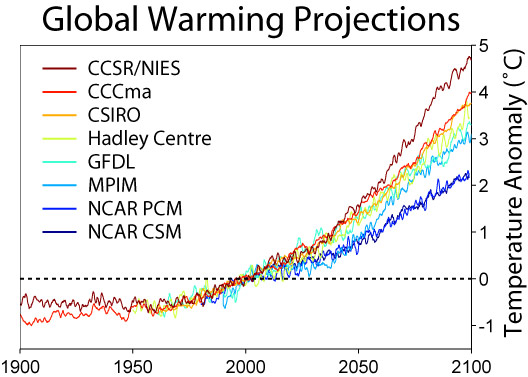
PREDICTIONS OR PROJECTIONS. The models used in the supercomputers use interrelationships of many variables and observed data to generate outputs of a chosen variable such as average temperatures in the sea surface for a given set of conditions. In general predictions are made when the full set of conditions are known (such as in a lab setting) and a projection is made when the final conditions are not known but can be set up as a series of scenarios. In this case the projection is global atmospheric warming in several specific sets of circumstances.
CA– USE AND EFFECT. Matching correlations to mechanisms and processes that attempt explain the mechanism behind the relationships. Once a strong correlation is observed, the reason for the match is investigated. Is it coincidence, some reason why it is linked to another variable or is it a true cause and effect relationship?
HYPOTHESES Statements that describe a unique condition or observation or event that is a necessary consequence of the proposed cause and effect relationships. This makes it possible to test the hypothesis for true false results.
In this example, Let’s make the statements in hypothesis form:
1) If CO2 is the cause of global warming the stratosphere must be cooling while the troposphere is warming.
2) If the sun is the cause of the warming both the troposphere and the stratosphere would be warming together.
So the test of the hypothesis that is a true or false choice is to check and see if the two areas of the atmosphere are rising in temperature together or in opposite directions. In this example the stratosphere is cooling while the troposphere is warming.
Hypothesis 1) CO2 is the cause of warming is not falsified.
Hypothesis 2) The sun is the cause of the warming is falsified.
The temperature trend for the troposphere.
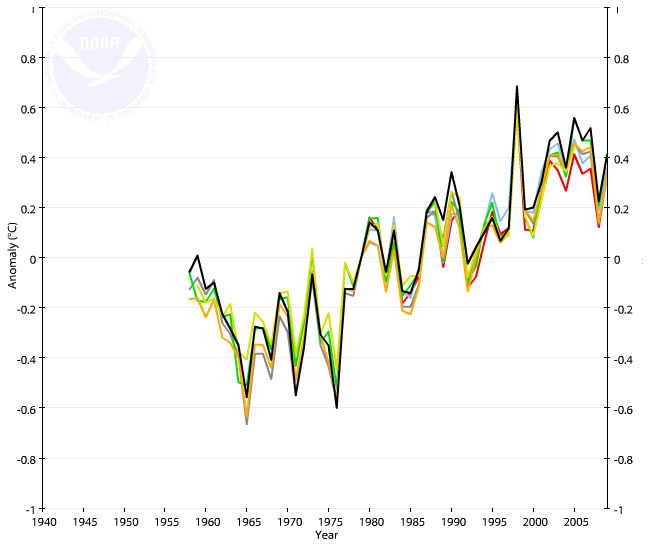
The temperature trend for the stratosphere.

THEORY A theory is a based on a coherent set of ideas used to explain a single or a collection of facts, an or series of events (such as volcanic eruptions), or phenomena (such as how sun dogs form). Typically, a theory is developed through the use of contemplative and rational forms of abstract and generalized thinking founded on evidence such as observation or experiment. Theory is often based on general principles that are independent of the thing being explained. Depending on the context, the results might for example include generalized explanations of how nature works.
Confusion can result from using terms that have one meaning in science and another meaning in everyday conversation.
Theory is one typical term that has very different meaning in science from general use. In science a theory is a relatively well developed explanation about how something works. It is based on combinations of observations, experiments (where these are possible), and direct and indirect tests. By contrast in general conversation a theory is often akin to a wild ass guess, or an opinion, or can be derived from ideology with no particular evidence.
Hypothesis is another easily confused term. In science it is very specific. An hypothesis is always in the form of a statement that can be falsified with a test or specific observation. In general parlance, hypothetical usually means something more like: “Suspend your disbelief while I talk about this idea I have. Hypothetically we could say that x …”
A scientific model is a device (mathematical, intellectual, logical, etc.) designed to be useful in predicting outcomes when certain conditions are met. Sometimes they are simple and designed to predict just one thing. Sometimes they are complex and attempt to mimic the behaviour of large and complex natural phenomena, such as the climate. A model by definition is predictive, but the predictions are only as accurate as the modeller mirrors the behaviour of nature in all its complexities. Usually there is no need to be able to predict everything. That would mean reproducing a nature – and we are not even close to that yet. Instead models are designed to predict the aspects that are important to the modeller and usually that reflects a question that has been posed. The term model in everyday parlance really has little to do with the scientific meaning. Often a model is a stand-in look-alike (toys are often modelled after real objects, for example).
Correlations are not models, nor are they by themselves predictive. In the real world, correlations are usually all scrambled up with other variables. In science, the amount of the variation that is explained by a trend line through the data set in a correlation is usually expressed as a percent statement such as 50% of the variation in the data set is explained with “x”% confidence. Often confidence limits begin at 95%, which basically means don’t be surprised if the variation spills outside the lines defining the range of variation about once every 20 times.
