The Claim
At least in Europe and North America, we hear politicians equating lower taxes to an abundance of jobs. Some politicians even go so far as to suggest that free market capitalism is a panacea for the unemployment problem, that if rules, regulations, and taxes are reduced or eliminated, businesses will mushroom in productivity and jobs will be created in record numbers. But what are the actual observations to back up this claim?
Some Background
Recall that the reason capitalism evolved (and it was a spontaneous evolution, not a designed development) was to increase the power of a business to control the production and distribution of products so that the profit could be maximized. The trick to accomplish this is to combine the assets of a number of people (capitalists) into a corporation so it can more effectively achieve control, sometimes by competition, sometimes by acquisition, and sometimes by merger. The profit is then split amongst the capitalists. Where do the rest of the people fit? They are the employed and unemployed. The capitalist corporation views both employees and unemployed people as resource packages of energy and skills to be used at the lowest possible cost to improve the profit level. If the local employees are too expensive, the labour is either transported to an offshore, cheaper location, or replaced by machinery. So there is no inherent reason why capitalism needs “people”, it needs energy and skills at the lowest possible cost.
If we compare this to an ecological system, unemployed people are essentially the same as individuals within a species that are not adapting or competing very well. In a natural system, they will ultimately die unless they find a way to adapt or compete successfully. As I have pointed out in earlier blogs, some species produce many young to compensate for this potential mortality. Employees are the equivalent of resources or prey. In these species and systems that require many young to maintain at least a stable population, there is a high mortality (=unemployment) rate. The ecosystems that have the lowest mortality rates are rain forests, coral reefs, and kelp forests, where species are highly specialized, compete fiercely and have few young which are nurtured. These systems also have very large primary producers (= farming, fishing, forestry, mining) that create an infrastructure that encourages many degrees of interdependence. Consumers are highly variable in size and form. The critical feature of these systems is their circularity in which every resource is returned to the air, to the water, or to the soil by some type of organism that acts as a decomposer. Economic systems have not yet evolved to this stage, but they do react in similar manners.
Lowered taxes is like a reduction in selection pressure, favouring corporations that need a high level of unemployment to keep the cost of employees down (species that produce many young so at least a few will survive). Higher taxes (= higher mortality rates) increase selection pressures, focus competitive innovation, and encourage fewer young that are nurtured and trained, an equivalent of economic competitiveness, innovation, fewer unemployed people because there is a more significant investment in the employees that the corporation have, resulting in a reduced rate of employee turnover.
Actual Observations
So what actually happens to unemployment rates in a capitalist system when taxes are raised or lowered? Using the US as an example, President Bill Clinton raised taxes in 1993 and the unemployment rate fell from 6.9 to 6.1 percent. It kept on falling under the higher taxes for the next seven years. Enter President Bush in 2001. He cut taxes and the unemployment rate climbed from 4.7 to 5.8 percent and then to 6 percent. In 1964 federal taxation as a share of the economy stood at 17.5 percent and unemployment was at 5.2 percent. Income taxes were cut in 1965 to 17 percent of the economy. Unemployment dropped to 4.5 percent. However, in 1969, tax levels increased to 19.7 percent of the economy and unemployment fell to 3.5 percent. Beginning in 1981 and over a period of two year, President Ronald Reagan, now held up as the exemplar for low taxes and minimum government, cut taxes from 19.6 percent of the economy to 17.4 percent. The unemployment rate responded by climbing back up from 7.6 percent to 9.6 percent. Taxation rates rose to 18.3 percent of the economy by 1989, and unemployment fell to 5.3 percent.
The relationship between taxes and unemployment is not consistent. Greece’s corporate tax rate is 24 percent, just slightly above the median for all 27 Eurozone nations, and their unemployment rate is among the highest. Ireland has one of the lowest corporate tax rates, but their unemployment is also among the highest. So tax rates and unemployment are not easily co-related. in fact, low corporate tax rates are definitely not a sure-fire recipe for more jobs. In Canada, it has been an interesting time of constantly lowering corporate tax rates, but increasing unemployment, while at the same time, increased corporate profit levels, and increased retained earnings. Thus the corporations have money, but are not offering jobs.
Despite the ups and downs of unemployment the actual tax revenues as a percent of GDP have been remarkably steady for many countries.
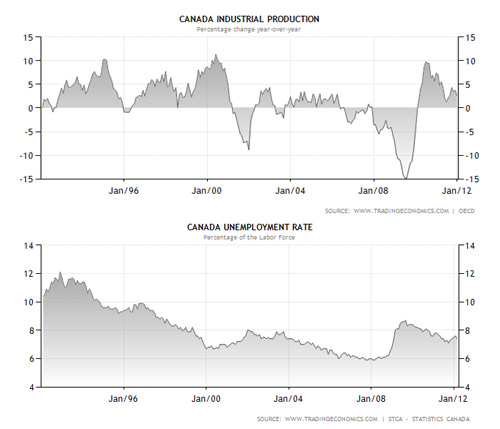
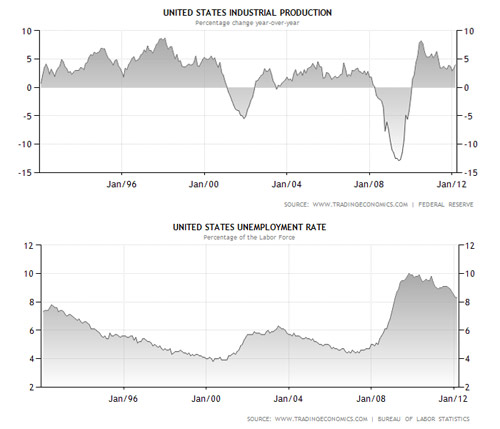
Is there something that is related? It is, of course, a mix of factors, but capitalists only produce products in response to an existing or predicted market, not to changing profit levels. They only hire people as employees if they have products to make. By comparing the unemployment rate to the industrial production rate in both Canada and the United States, we can see a relationship. It is not perfect, but it is highly suggestive. For example in Canada, the period from 1992 to 1995 had relatively stable high production rates and unemployment steadily declined in that period. A downturn in industrial production in mid 1995 to mid 1996 raised unemployment. Industrial production was high from late 1996 to mid 2001 and unemployment fell steadily in this period. A drop in production in 2002 resulted in an increase in unemployment. Moderate production levels from then until 2007 held unemployment at a steady level. in 2007 through 2010 production levels plummeted and unemployment increased rapidly. A recent increase in production levels has caused a gradual decline in unemployment levels until today. (Information in the charts from www.tradingeconomics.com which in turn taps the Federal Reserve, Bureau of Labor Statistics, OECD, and Statistics Canada).
The history in the US is even more consistent, presumably because the overall economy is larger and smooths out some of the variability. From 1992 to 2001, production levels were variable, but all quite positive. During that period, the unemployment rate fell steadily to less than 4%. A downturn in production from 2001 to 2002 caused an upswing in unemployment. But from 2002 through to 2008, production levels were all modest but positive and unemployment levels steadily declined again, although they did not dip below 4%. In 2008 there was a dramatic decline in production levels and presumably you are now not surprised to see the unemployment levels rise sharply in response at that time. Finally from 2010 until today, production levels have been up and unemployment levels are steadily declining again.
So there we have at least one variable, industrial production levels, that seems to be directly related to unemployment. We have seen that reducing taxes is not related to unemployment, and therefore is not related to industrial production levels either. Business people either capitalists or simple entrepreneurs, produce what they perceive the market will buy. If there is no market, there will be no products, and unemployment will rise. So what increases the market size?
But there is another variable that matches the unemployment rate even more perfectly. I first checked business confidence index levels against unemployment, and although there was a vague relationship to unemployment, the variable that really matched is the consumer confidence index. To illustrate I have inverted the consumer confidence index directly over top of the unemployment rate. They are to different scales on the Y axis of course, but the time axis is identical. The match is remarkable.
What does this mean?
Sometimes there is an apparent relationship between two variables that is not related to direct cause and effect. Is this the case here? Regardless, the fit of the two curves is so good it cannot be ignored. Perhaps it is because if consumers are not confident, they are not buying. This may be because they are hoarding or they simply cannot afford to buy. If that is the relationship then employers must employ a mechanism of judging the market so that they terminate employees in direct proportion to the interest consumers have in making purchases.
Let’s examine the Consumer Index to be sure it is going to be independent of the unemployment rate. First of all it is an attitudinal index, not a data-based index. So the index does not contain unemployment numbers. Basically a higher index indicates greater consumer confidence in continued economic good times and even growth. And a decreasing index reflects an attitude predicting slower economic growth or even a declining economy. The more confident people feel about the economy, the more likely they are to make purchases. If we examine the questions, however, we see that the attitudes also reflect something about their own employment confidence:
Current business conditions
Business conditions for the next six months
Current employment conditions
Employment conditions for the next six months
Total family income for the next six months
The relative value for each question is then compared against each relative value from 1985. This comparison of the relative values results in an “index value” for each question. The index values for all five questions are then averaged together to form the Consumer Confidence Index; the average of index values for questions one and three form the Present Situation Index, and the average of index values for questions two, four and five form the Expectations Index. The data are calculated for the United States as a whole and for each of the country’s nine census regions.
The index itself is not therefore a direct measure of unemployment. It is instead a measure of the opinion about employment opportunities, the economy, and personal income. It is likely to be however, and pretty good predictor of whether the consumer is in a spending or a saving mood. Now the $million, wait no, the $multi-trillion question is which comes first, consumer spending or the unemployment rate anticipating changes in consumer spending.
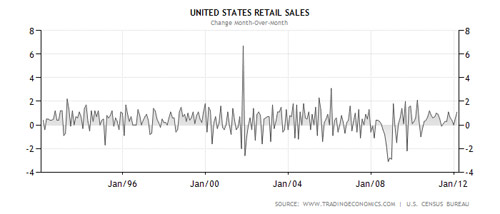
A quick glance back at the super-imposed curves shows that unemployment lags behind attitudinal changes. So the attitude predicts unemployment. Does it cause unemployment directly? Ah ha, presumably retail sales will also be a good predictor of when companies need to ditch employees.

Oh dear, that did not work. So there is some other way that producers judge when to slow down production and ditch employees, and it is not the business confidence index.


